PYTHON CODING
- Oct 16, 2025
- 1 min read
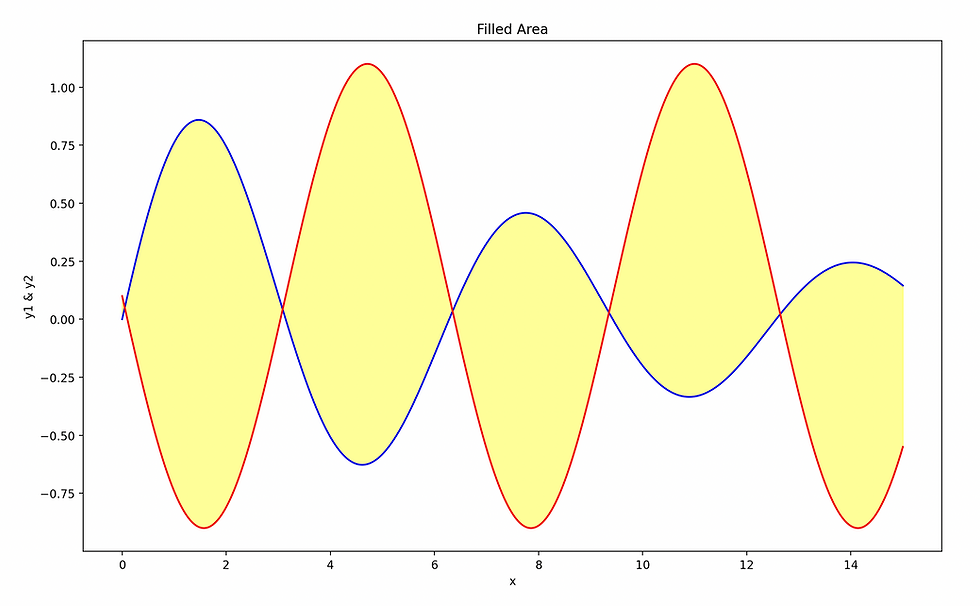
import matplotlib.pyplot as plt
import numpy as np
x = np.linspace(0, 15, 1000)
y1 = np.exp(-0.1*x) * np.sin(x)
y2 = np.cos(x + np.pi/2) + 0.1
plt.fill_between(x, y1, y2, color='yellow', alpha=0.4)
plt.plot(x, y1, color='blue')
plt.plot(x, y2, color='red')
plt.title("Filled Area")
plt.xlabel("x")
plt.ylabel("y1 & y2")
plt.show()

Try to run Python to verify.